Gene gain/loss tree
The Gene Gain/Loss tree summarises the phylogenetic history of a Ensembl gene-family by showing gene gain events (expansions) and gene loss events (contractions) over time.
A red branch on the tree indicates a significant expansion of the gene at that point in its history, a green branch denotes a contraction and a grey branch indicates that there was no significant change.
The numbers at each node refer to the number of different genes in the ancestral species (as predicted with the CAFE1 tool). The colour of each node reflects the number of members (or genes) coloured according to the legend below.
The species names are coloured; red (species for the current gene of interest), black (species with current genes in Ensembl in this tree) and grey (species with no current genes in this tree).
For ncRNA genes, where available, only a selected tree consisting of human, chimp, marmoset, mouse, zebrafinch and zebrafish species is displayed. Note, in these trees, the species of interest may not be present.
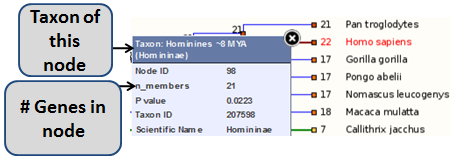
Click on any node for a pop-up menu of information, as shown in the image below.
FIGURE 1

A branch will only be marked as an expansion or contraction if the p-value as determined by CAFE is <0.01. The p-value is shown in the case of an expansion or contraction (compared with the previous node). If no significant change has occured, the p-value shown is 1-(p-value).
Click on the icons at the top left to change what you can see.
FIGURE 2
![]()
A minimal tree only displays species which have the gene, whereas a full tree displays all species.
1. CAFE links:
Article: CAFE: a computational tool for the study of gene family evolution (Hahn et. al)
Lab page: Hahn lab
